
Abstract
PURPOSE We undertook a study to evaluate variation in the availability of primary care new patient appointments for Medi-Cal (California Medicaid) enrollees in Northern California, and its relationship to emergency department (ED) use after Medicaid expansion.
METHODS We placed simulated calls by purported Medi-Cal enrollees to 581 primary care clinicians (PCCs) listed as accepting new patients in online directories of Medi-Cal managed care plans. Data from the California Health Interview Survey, Medi-Cal enrollment reports, and California hospital discharge records were used in analyses. We developed multilevel, mixed-effect models to evaluate variation in appointment access. Multiple linear regression was used to examine the relationship between primary care access and ED use by county.
RESULTS Availability of PCC new patient appointments to Medi-Cal enrollees lacking a PCC varied significantly across counties in the multilevel model, ranging from 77 enrollees (95% CI, 70-81) to 472 enrollees (95% CI, 378-628) per each available new patient appointment. Just 19% of PCCs had available appointments within the state-mandated 10 business days. Clinicians at Federally Qualified Health Centers had higher availability of new patient appointments (rate ratio = 1.56; 95% CI, 1.24-1.97). Counties with poorer PCC access had higher ED use by Medi-Cal enrollees.
CONCLUSIONS In contrast to findings from other states, access to primary care in Northern California was limited for new patient Medi-Cal enrollees and varied across counties, despite standard statewide reimbursement rates. Counties with more limited access to primary care new patient appointments had higher ED use by Medi-Cal enrollees.
- Patient Protection and Affordable Care Act
- insurance
- health
- Medicaid expansion
- national health insurance
- United States
- health services accessibility
- vulnerable populations
- primary care access
- barriers
- simulated patient
- secret shopper
- practice-based research
INTRODUCTION
The Patient Protection and Affordable Care Act increased federal funding to encourage states to expand Medicaid eligibility. California was an early adopter of the act and began expanding Medi-Cal (California’s Medicaid) in 2011 to cover more low-income Californians. Medi-Cal covered 4.13 million low-income California children and their parents that year. The managed care population increased from 4.13 million enrollees in December 2011 to 6.02 million enrollees in December 2013. Medi-Cal expanded program eligibility over several years from 100% of federal poverty level to include adults earning up to 138% of the level and children in families with income up to 266% of the level.1 By 2015, the number of Medi-Cal enrollees had increased to about 12 million, representing roughly 33% of the state’s population and 54% of children.2
Medi-Cal is jointly administered by the state and its counties; more than 80% of enrollees are in Medi-Cal managed care plans to improve care coordination and fiscal predictability.3 As a result, Medi-Cal enrollees generally must seek primary care from a plan-affiliated clinician within the enrollee’s county of residence. California regulation requires managed care plans to ensure access to primary care within 10 business days of an appointment request.4 A typology of barriers to health care developed by DeVoe et al5 identified health care access as the most common concern for publicly insured families.
The limited supply of primary care clinicians (PCCs) available to meet demand for care has been documented.6-8 Between 2013 and 2015, full-time equivalent physicians participating in Medi-Cal increased by only 9% while Medi-Cal beneficiaries increased by 60%, presenting challenges for enrollees seeking medical care.9
Although studies of appointment availability from other states report that expansion of the Medicaid program has led to more, not less, access to PCCs,10-12 payment increases have also been reported to have little effect on Medicaid clinician participation rates across states13 despite increased 2013-2014 PCC reimbursement rates.
We conducted a simulated patient caller (secret shopper) study to assess availability of new patient appointments to Medi-Cal enrollees. Because of California’s county-based administration of Medi-Cal managed care, we hypothesized that access to primary care for Medi-Cal enrollees needing a PCC would vary across counties. Federally Qualified Health Centers (FQHCs) have been shown to have greater appointment availability in other states,14 so we considered the influence of PCC affiliation with an FQHC on access. We also hypothesized that counties with worse primary care access for Medi-Cal enrollees would have higher emergency department (ED) use. We selected 8 contiguous counties in Northern California representing a range of large and small, and urban, suburban, and rural counties, and including all 4 Medi-Cal managed care models. Our study provides a representative baseline for future statewide comparative research and a method for researchers seeking to examine regional variation in access.
METHODS
Overview
The study was approved by the institutional review board of the University of California, Davis. To examine the impact of increased demand for primary care between counties, we determined the availability of PCC new patient appointments for Medi-Cal enrollees needing a PCC in an 8-county region of Northern California. Calls from simulated patients seeking appointments were made to PCC practices from July through August 2015. We analyzed the relationship between PCC appointment availability and ED use by managed care Medi-Cal enrollees for each county.
PCC Identification
Clinicians designated as accepting new patients were identified through online directories posted by Medi- Cal managed care plans operating within the study region. We contacted PCCs (family physicians, internal medicine physicians, pediatricians, nurse practitioners, and physician assistants) listed in the online plan directories as accepting new Medi-Cal patients. Those practicing in FQHCs were noted. In the case of one large managed care plan, the online directory identified no clinicians who were accepting new patients, and simulated patient calls made to that plan’s helpline were unsuccessful in obtaining a list of clinicians accepting new patients. The caller was advised by the plan to simply start calling listed clinicians, so we applied a modified sampling scheme that included universal sampling of all plan-listed PCCs in counties with 20 or fewer PCCs and systematic sampling of every fifth-listed PCC in counties with more than 20 PCCs within this plan’s network. PCC appointment availability in each county where this plan operated was adjusted for this sampling scheme. We excluded a closed-panel health maintenance organization plan operating in a single county and excluded patients enrolled in that plan from the estimated patients in need of a PCC.
Simulated Patient Call Protocol
Two caller scripts written by a primary care physician (J.M.) represented either a new adult patient seeking an asthma medication refill or a parent calling about a new child patient with mild allergy symptoms. Trained research assistants following the scripts called PCC offices requesting an appointment for a new patient seeking either adult or pediatric primary care with a specific clinician by name. Adult or pediatric scripts were applied based on the PCC’s listed patient focus. Family physicians and family nurse practitioners were variably allocated adult or pediatric scripts in 50% of appointment-scheduling attempts. Call outcomes included appointment offered with the requested clinician, appointment offered with an alternate clinician, no appointment available (clinician not scheduling new patients), or deferred attempt (when the office required detailed health information, signed forms, or a preappointment before it would offer an appointment time).
All study calls were completed over 2 months (July and August 2015). Research assistants were trained to respond in a way to maximize successful appointment scheduling with either the requested PCC or, if not available, an alternate. Appointment availability was requested once per PCC, and any appointment offered was accepted. Some PCCs were members of group practices with a limited number of staff scheduling appointments. A maximum of 2 calls per week were attempted to each practice with multiple clinicians; call attempts were alternated from a male caller and from a female caller. If this maximum was reached, callers waited 1 week before attempting to reach additional clinicians within the same practice. To safeguard anonymity, the study protocol limited the total number of contacts made to group practices. A maximum of 3 calls were made to practices with fewer than 8 PCCs; larger practices were contacted up to 8 times. If more PCCs were potentially available in the practice, a scripted call was made to inquire about whether each of the remaining PCCs had new-patient appointments available for Medi-Cal enrollees. To avoid occupying space in the clinician schedule, the research assistant concluded each successful call by stating he or she would call back to confirm any appointment after checking a work schedule.
PCC Access Analysis
For each county, we calculated the percentage of available appointments with the requested clinician (the original clinician requested by our caller) and with any clinician (the requested clinician or an alternate clinician within the practice). We calculated percentages of any clinician appointments scheduled within 10 business days of the contact to estimate availability of appointments meeting this state requirement.
To estimate primary care access for Medi-Cal enrollees, we considered the number of available PCC new appointments and the percentage of Medi-Cal enrollees without a regular PCC. The percentage of Medi-Cal enrollees potentially in need of a PCC in each county was estimated from the region’s responses to the 2015 California Health Interview Survey (CHIS) question on usual source of care as "no usual source of care" or "other/no one place" or "emergency room/urgent care." These responses were combined as the total percentage in the region potentially in need of a PCC and multiplied by the total number of Medi-Cal enrollees in each county’s Medi-Cal plans included in the study. This process estimated the number of Medi-Cal enrollees potentially needing a PCC new patient appointment. The county Medi-Cal PCC new patient appointment access ratio was calculated as the number of enrollees potentially needing a new patient PCC appointment per available PCC new patient appointment in the county at the time of our survey. Higher ratios indicated poorer access to primary care (more patients in need of an appointment per available appointment).
To compare the PCC access ratio between counties, we developed multilevel mixed effects regression models using Poisson distribution and log-link function adjusted for caller script (adult or pediatric clinician) and whether a clinician was affiliated with an FQHC. County was included as a random effect to test whether appointment availability for a particular county was significantly different from the 8-county average after adjustment. The random effects model allowed estimation of group county effect as well as effects of other county-level factors. The dependent variable was the event count of available clinician appointments in each county; we included the log of the number of Medi-Cal enrollees potentially seeking a PCC per available clinician in each county as an offset. All clinicians contacted in the 8 counties were included in the regression analyses. Analyses were completed using SAS version 9.4 (SAS Institute Inc).
ED Use Analysis
EDs provide access to health services without an appointment and serve as a usual source of care for some Medi-Cal enrollees. Medi-Cal managed care enrollment does not limit emergency care access. We therefore assessed the relationship between ED use by Medi-Cal enrollees (adjusted for the proportion enrolled in managed care for each county) and access to Medi-Cal PCC new patient appointments by county. We obtained ED encounters during 2015 for Medi-Cal enrollees by county of residence from the California Office of Statewide Health Planning and Development. The 2015 Medi-Cal managed care enrollments by county were obtained from the California Department of Health Care Services. To estimate the ED use rate by Medi-Cal managed care enrollees for each county, the total number of Medi-Cal managed care enrollee ED encounters was adjusted for the number of Medi-Cal managed care enrollees. We used multiple regression analysis, adjusting for age and sex, to examine the relationship between the Medi-Cal access ratio and Medi-Cal enrollee ED use rate by county.
RESULTS
We attempted to contact 589 PCCs in the 8 contiguous Northern California counties studied and ultimately contacted 581 PCCs: 460 primary care physicians, 61 physician assistants, and 60 nurse practitioners (Table 1). Eight clinicians could not be contacted (did not answer or had a disconnected telephone). The 8 study counties (El Dorado, Placer, Sacramento, San Joaquin, Solano, Sutter, Yolo, and Yuba) represented 754,547 managed care Medi-Cal enrollees distributed across urban, suburban, and rural populations. These counties had a total of 1,761 PCCs practicing in 201515; the majority were not listed in Medi-Cal managed care provider directories as accepting Medi-Cal enrollees for new patient appointments.
Medi-Cal Enrollees and PCCs Contacted to Schedule Simulated New Medi-Cal Patient Appointments by County
The average percentage of requested PCCs who had any appointment available varied by county, from a low of 23% in Placer County to a high of 50% in San Joaquin County (Table 2). The average percentage of any PCC within a practice having any appointment varied from 36% in Placer and Solano Counties to 76% in Yolo County. Median wait times to a scheduled appointment with any available PCC by county ranged from 7 to 32.5 days. Across the region, on average, only 34% of PCCs contacted had any appointment available and only 19% had an appointment within the state-required 10 business days, ranging from a low of 6% in El Dorado County to a high of 50% in Yuba County.
Available Appointments With and Wait Times for Medi-Cal PCCs in 8 California Counties
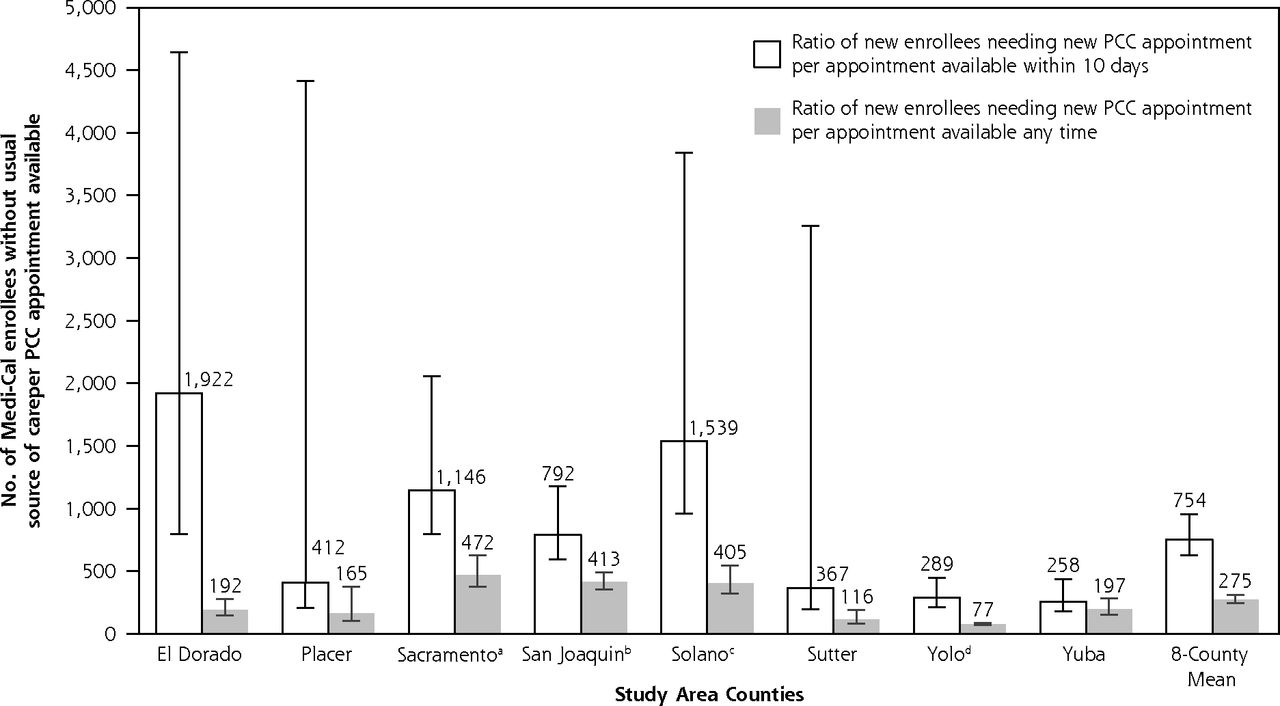
On the basis of CHIS responses, we estimated that 14.3% of Medi-Cal enrollees in the region were potentially in need of a PCC. Accounting for the potential need for new PCC appointments in each county, the PCC new patient access ratio (number of enrollees in the county needing a PCC per available new patient appointment) varied widely (Figure 1). Multilevel modeling with clinicians nested within study counties indicated that Sacramento, San Joaquin, and Solano counties had significantly worse access to primary care new patient appointments, with PCC access ratios of 472 (95% CI, 378-638), 413 (95% CI, 355-494), and 405 (95% CI, 322-526) enrollees per any available PCC appointment, respectively, compared with the 8-county mean of 275 (95% CI, 245-311). In contrast, the PCC access ratio of 77 (95% CI, 70-86) enrollees per available appointment in Yolo County was significantly lower than the mean, indicating better PCC access. Overall, very few clinicians had appointments available within 10 business days, but Sacramento, San Joaquin, and Solano Counties were significantly worse, and Yolo county was significantly better than the 8-county average in the adjusted model.

Cross-county comparison of Medi-Cal PCC new patient appointment availability using the PCC new patient access ratio.
Medi-Cal = California Medicaid; PCC = primary care clinician.
Note: Error bars indicate 95% CIs. The ratio reflects the number of Medi-Cal patients potentially in need of a new patient appointment with a PCC (the numerator) per available PCC appointment in the county (the denominator). A higher ratio signifies worse access to primary care. More enrollees per available appointment represents a greater demand relative to available appointment.
aWorse than 8-county mean (P = .002).
bWorse than 8-county mean (P = .02).
cWorse than 8-county mean (P = .04).
dBetter than 8-county mean (P <.001).
Appointment availability did not differ significantly between adult and pediatric clinicians. Within counties, PCCs in FQHCs were more likely to have any appointment available than their counterparts in non-FQHC facilities (rate ratio = 1.56; 95% CI, 1.24-1.97).
Adjusted for enrollee age and sex, counties with worse PCC new patient access (higher numbers of patients needing a PCC per available appointment) also had higher ED use by Medi-Cal enrollees (Figure 2). For each additional 100 Medi-Cal managed care enrollees lacking a regular source of care per available PCC appointment, there was an associated 5.9% (95% CI, 1.0%-10.8%) increase in enrollee ED visits (R2 = 0.47; P = .03).

Ratio of Medi-Cal enrollee ED visits to new patient primary care access, by county.
ED = emergency department; Medi-Cal = California Medicaid.
Note: Multiple regression analysis adjusted for enrollee age and sex, and proportion of managed care enrollees. Circle sizes represent the number of Medi-Cal managed care enrollees in the county. There was an associated 5.9% (95% CI, 1.0%-10.8%) increase in enrollee ED visits (R2 = 0.47; P = .03) for each additional 100 enroll-ees lacking a regular source of care per available appointment.
DISCUSSION
Our simulated patient caller study found significant regional variation in access to primary care appointments for new patient Medi-Cal enrollees, and overall longer appointment wait times than those mandated by state regulations. Counties with worse access to primary care appointments for new Medi-Cal patients also had higher ED use by Medi-Cal enrollees. Although this observational association does not establish a causal relationship, the association provides some face validity to findings on primary care access.
Access to primary care has been strongly associated with improved health outcomes and diminished health disparities.16 Overall, PCC access for Medi-Cal enrollees without a usual source of care in this 8-county region of California was limited, even though they had insurance coverage. Many PCCs listed as accepting new Medi-Cal patients in the health plans’ online directories did not have any available appointments. Online clinician directories are notoriously inaccurate,17,18 yet these directories are the primary source of information for enrollees seeking care. Legislation implemented in 2016 requiring health plans and insurers to update online clinician directories weekly19 may help new patients more accurately identify PCCs accepting new patients, but the lack of PCC availability to new patients remains. In Medi-Cal managed care plans, PCCs are also the access point for specialty care; hence, lack of access to PCCs also constrains access to specialists.
Other studies have examined state-level access to appointments for Medicaid enrollees,11,12 but ours is the first study that we know of to consider county variation in PCC access and to examine corresponding differences in ED use. The simulated patient caller approach provides a meaningful way to evaluate access to care from the patient perspective. It has been used to validate survey reports by primary care physicians about acceptance of new Medi-Cal enrollees.20 Simulated caller studies have found that commercially insured patients in California also encounter difficulty scheduling new patient appointments with PCCs,18 although baseline rates of PCC acceptance of new patients with commercial insurance or Medicare are higher.20
Whether the challenges in California are uniquely greater than those in other states is unclear. A study using a simulated caller methodology in Michigan found a 6% increase in PCC appointment availability associated with the implementation of Medicaid expansion but did not account for expanded need for new patient appointments. Appointments were attempted only in the 54% of practices responding to a telephone query that they accepted new Medicaid patients.12
Polsky et al10 conducted a 10-state study (not including California) of the availability of Medicaid primary care appointments before and after the temporary increase in Medicaid reimbursement for PCCs that was part of the Affordable Care Act. They identified an average increase of 7.7% in appointment availability after the increase in reimbursement, with a median wait time of 6 days in both periods. This increase persisted in a follow-up survey in 2016. Considerable variation in appointment availability between states was identified, with the lowest availability in Oregon (34.9%). A similar study adding FQHCs to the sampled practices in the same 10 states found comparable results.21 These analyses did not account for variation by state in the number of new enrollees needing an appointment with a PCC.
Our simulated experience of locating primary care for individuals and families with Medi-Cal coverage is consistent with the typology of DeVoe et al5 suggesting that access to care is a critical priority. Accounting for variation in the number of Medi-Cal enrollees potentially needing a new patient appointment by county, our results suggest that Medi-Cal enrollees in one county may have a much harder time accessing a new patient primary care appointment than those in an adjacent county. Factors contributing to this variability include county-level Medi-Cal population differences, relative shortages of PCCs accepting new Medi-Cal patients, and number of FQHCs, as well as county-level structural and organizational factors related to Medi-Cal managed care plans. Although prior work from other states has suggested that increased reimbursement to Medicaid clinicians may improve appointment availability,10,11,21 our finding of variation across counties in the same state confirms that other factors are also important.
Only 19% of PCCs accepting new Medi-Cal patients in the study region met the state requirement that patients be able to obtain a requested appointment for routine care within 10 business days. As similarly shown in a study of other states,14 we found that PCCs affiliated with FQHCs offered better access to appointments for patients on Medi-Cal. Access differences between counties persisted, however, despite adjustment for FQHC clinicians. Determining which factors enabled Yolo County to have relatively high appointment availability or what contributed to Sac-ramento, San Joaquin, and Solano Counties’ lower access will require additional research. Some clinicians accepting Medi-Cal may be at capacity for their practice despite being listed in the online directories. Qualitative research with clinicians, administrators, insurance plans, community health organizations, and Medi-Cal recipients would provide useful data to interpret our results.
We used empiric measurements of both primary care access and ED use, and found that counties having worse new patient primary care access had increased adjusted annual ED visits per Medi-Cal enrollee. EDs provide unscheduled access for all, regardless of assigned managed care plan network. Survey data suggest that patients with insufficient access to primary care are more likely to use EDs for nonemergent medical visits.22-24 In states that expanded Medicaid eligibility, increases in ED use and increases in the proportion of ED visits for primary care–treatable conditions were often observed.25-28 ED visits for primary care–treatable conditions result in fragmented care and contribute to ED overcrowding. Our analysis suggests that expanding Medi-Cal coverage in counties without sufficient expansion of PCCs has burdened EDs and likely increased costs relative to those in counties with better primary care access.
Limitations of this study include its cross-sectional perspective, which did not permit evaluation of change over time, including seasonal variation in new patient appointment availability. Repeated simulated patient caller studies over time would provide data on how access is changing for Medi-Cal enrollees. To avoid disrupting the practice or detection of simulated patient callers, we followed the standard practice in simulated patient appointment studies of attempting to schedule a single appointment per PCC. This approach identifies the proportion of clinicians with available new patient appointments, and mirrors the new patient experience of attempting to schedule an appointment, but some clinicians may have more available new patient appointments than others. We extrapolated from CHIS data to estimate the proportion of Medi-Cal enrollees potentially in need of a new appointment in the region, but the survey did not provide stable estimates down to the county level. In addition, the relatively small number of clinicians in smaller counties led to wider uncertainty in the adjusted comparisons of county-level new patient access in 10 business days for Medi-Cal enrollees.
Diagnoses were not available for the ED visit analyses, so adjustment for variation in diagnoses, specifically behavioral health diagnoses, was not possible. The geographic area of this study was limited to an 8-county region in California, but the study provides a much more detailed picture of regional variation than has previously been available. The policy variation inherent in local control of Medi-Cal creates a natural policy laboratory to study factors influencing access to primary care. Future research can identify innovations and strategies associated with improved access to primary care.
Expanding health care coverage to those without insurance is an essential first step in providing access to health care, but expansion may have unintended consequences when primary care access is limited, such as increased demands on overburdened EDs. Only adequate access to primary care will begin to improve health outcomes and control costs among beneficiaries of the Medicaid expansion.
Acknowledgments
The authors thank Mary Youm and Lukas McGregor for their invaluable assistance as research assistants and simulated patients.
Footnotes
Conflicts of interest: authors report none.
To read or post commentaries in response to this article, see it online at http://www.AnnFamMed.org/content/18/3/210.
Funding support: This project was supported in part by grant 5T32HS022236-04 from the Agency for Healthcare Research and Quality (Ethan Evans, Brock Daniels, Lindsey Woodworth); by the University of California, Davis Department of Family and Community Medicine Jumpstart Research Fund; and by grant AE00102 from the US Department of Health and Human Services, Office of the Assistant Secretary for Planning and Analysis (ASPE), through the UC Davis Center for Poverty Research.
Disclaimer: The views expressed in publications resulting from supported research do not reflect the official policies of the Department of Health and Human Services.
- Received for publication December 15, 2018.
- Revision received July 7, 2019.
- Accepted for publication August 13, 2019.
- © 2020 Annals of Family Medicine, Inc.
References
In this issue


Jump to section
Related Articles
Cited By...
- No citing articles found.